")
- PHÂN TÍCH DỮ LIỆU:
- Collecting Data from various sources – Thu thập dữ liệu nhiều nhất có thể, thu thập các feature có ảnh hưởng đến kết quả của mẫu, thu thập nhiều mẫu cành tốt
- Wrangling Data to make it more reliable:
- Reading data:
-
from sqlalchemy import create_engine
engine = create_engine('sqlite:///:memory:')

sql_dataframe   = pd.read_sql_table('my_table', engine, columns=['ColA', 'ColB'])
xls_dataframe   = pd.read_excel('my_dataset.xlsx', 'Sheet1', na_values=['NA', '?'])
json_dataframe  = pd.read_json('my_dataset.json', orient='columns')
csv_dataframe   = pd.read_csv('my_dataset.csv', sep=',')
table_dataframe = pd.read_html('http://page.com/with/table.html')[0]
- Số hóa data.
- Feature dạng Category thì dùng astype(“category”)
- Có 2 loại feature:
- Continuous Features:
- Đây là những feature mà có giá trị liên tục, thường là số, đại khái tập hợp các giá trị thì có thể tạo nên một đường tuyến tính.
- Ví dụ như nhiệt độ, time line, giá cả
- Categorical Features:
- Đây là những feature có giá trị rời rạc, hoặc rời rạc có thứ tự, thường là text.
- Categorical Features chia làm 2 loại:
- Nominal: là feature có giá trị rời rạc, thường là text và chúng có rất ít liên kết với nhau, khó so sánh. VD brand: merc, bmw, audi…
- Ordinal: là feature có giá trị rời rạc nhưng có thứ tự, và giá trị của chúng thường được quy ước chung và có thể lấp đầy range của chúng. VD: low-medium-high, sad-neutral-happy….
- Dạng text thì dùng CountVectorizer()
- Dạng ảnh thì dùng imageio
- Dạng âm thanh wav thì dùng scipy.io.wavfile
- Xử lý missing data, đưa column type về đúng kiểu
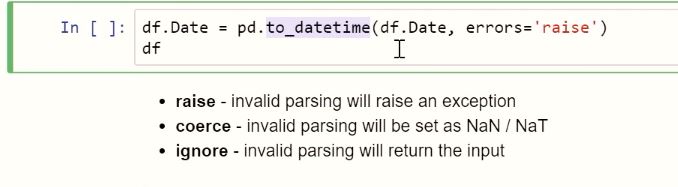
- Ép Column Type Date:
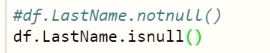
- Check value null ở column chứa text:
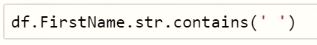
- Check value chứa khoảng trống ở column chứa text:
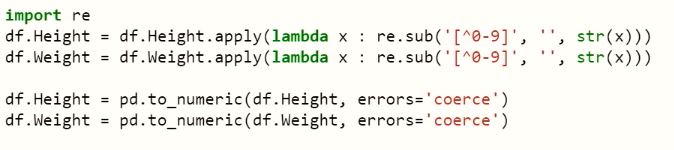
- Loại bỏ những ký tự không phải số ra khỏi value sau đó ép Feature Height và Weight:
- Xóa các row có value trùng nhau:

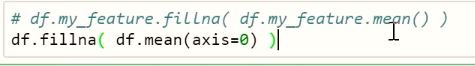
- Thay thế các chỉ số NA bằng trung bình cộng trên các column số:
- Sau khi data đã được clean thì đặt lại chỉ mục bằng lệnh:

- Ngoài ra có nhiều cách để xử lý value NaN. Như là gán nó bằng với value khác NaN nằm trước nó hoặc nằm sau nó hoặc nội suy value….
- Phương án cuối cùng nếu như không xử lý được value NaN trong mẫu data thì ta drop nó:
-
df = df.dropna(axis=0)
df = df.dropna(axis=1)
df = df.dropna(axis=0, thresh=4)
df = df.drop(labels=['Features', 'To', 'Delete'], axis=1)
df = df.drop_duplicates(subset=['Feature_1', 'Feature_2'])
df = df.reset_index(drop=True)
df = df.dropna(axis=0, thresh=2).drop(labels=['ColA', axis=1]).drop_duplicates(subset=['ColB', 'ColC']).reset_index()
- Exploring Data using statistics and visualizations – Trực quan data, biểu diễn các feature, xem đc mỗi tương quan các feature, chúng đọc lập tuyến tính hay không.
- Histogram – Biểu đồ phân phối các gia trị:
import pandas as pd
import matplotlib
matplotlib.style.use('ggplot')
student_dataset = pd.read_csv("/Datasets/students.data", index_col=0)
my_series = student_dataset.G3
my_dataframe = student_dataset[['G3', 'G2', 'G1']]
my_series.plot.hist(alpha=0.5)
my_dataframe.plot.hist(alpha=0.5)
- 2D – Xem xét mối quan hệ giữa 2 feature:
import pandas as pd
import matplotlib
matplotlib.style.use('ggplot')
student_dataset = pd.read_csv("/Datasets/students.data", index_col=0)
student_dataset.plot.scatter(x='G1', y='G3')
- 3D – Xem xét mối quan hệ giữa 3 feature:
import matplotlib
import matplotlib.pyplot as plt
from mpl_toolkits.mplot3d import Axes3D
import pandas as pd
matplotlib.style.use('ggplot')
student_dataset = pd.read_csv("/Datasets/students.data", index_col=0)
fig = plt.figure()
ax = fig.add_subplot(111, projection='3d')
ax.set_xlabel('Final Grade')
ax.set_ylabel('First Grade')
ax.set_zlabel('Daily Alcohol')
ax.scatter(student_dataset.G1, student_dataset.G3, student_dataset['Dalc'], c='r', marker='.')
plt.show()
- Transforming Data to prepare it for modeling – Giảm kích thước, nén dữ liệu, loại bỏ những feature dư thừa
- PCA:
>>> from sklearn.decomposition import PCA
>>> pca = PCA(n_components=2, svd_solver='full')
>>> pca.fit(df)
PCA(copy=True, n_components=2, whiten=False)
>>> T = pca.transform(df)
>>> df.shape
(430, 6)
>>> T.shape
(430, 2)
- Feature Scale – Giảm giá trị range giữa các feature
- Split data. Chia thành các tập train, test, CV….
- Modeling Data using the right machine learning algorithms – Sử dụng các thuật toán ML để training data. ( K-means, KNN, Linear Regression, SVM, Decision Tree, Random Forests)
- Evaluating the results of the data models
Đăng bởi Bạch Tuấn
Machine Learning Tùy Bút
Xem tất cả bài viết bởi Bạch Tuấn